UTMB just exposed how your Index is really built — here's what it doesn't tell you
UTMB slipped a "Calculation details" panel online with no announcement. I scraped around 500 of them — the top 50 of every category, men and women — and reverse-engineered the part nobody explains.


Two months ago I wrote that UTMB had rebuilt its index, and I left one thing unfinished. I understood how a single race gets scored. I did not understand how five race scores become the one number next to your name. The math above the race score was a black box.
Then UTMB quietly opened it. Beginning of last week a Calculation details view appeared on every runner’s profile — no announcement, no blog post. Click the big blue UTMB Index card, or any category card, and a panel folds out showing exactly how that number was built, row by row. The first thing I did was check my own profile. The second thing I did was build a scraper and pull the panels of the top 50 in every category, for both men and women — around 500 panels in all, each runner’s general plus their category list — because one profile tells you what the columns are, and five hundred tell you the rules underneath them.
Here’s what the rule turns out to be: your UTMB Index is governed by two mechanics that the panel shows but never explains. A clock that ages every result on a fixed schedule, and a floor that stops your weaker races from dragging you down. Once you can see both, the index stops being a verdict handed down from above and becomes something you can actually read — and plan around.
First, the refresher
For anyone who skipped the April piece: every race you run gets a single Race Score, built in four steps — the model finds comparable races, predicts an expected score for you, keeps only the reliable data, and draws a best-fit line to turn your finish time into a number between 0 and 1000. That part is the April story. What stayed opaque was the layer above it: how a pile of those race scores becomes your Index. That’s the layer this panel cracks open.
It lists your five best performances and runs each through five columns. Here is what each one does, read off Hannes Namberger’s general index of 931 (before Lavaredo 120k - last weekend) — the panel itself explains almost none of it:
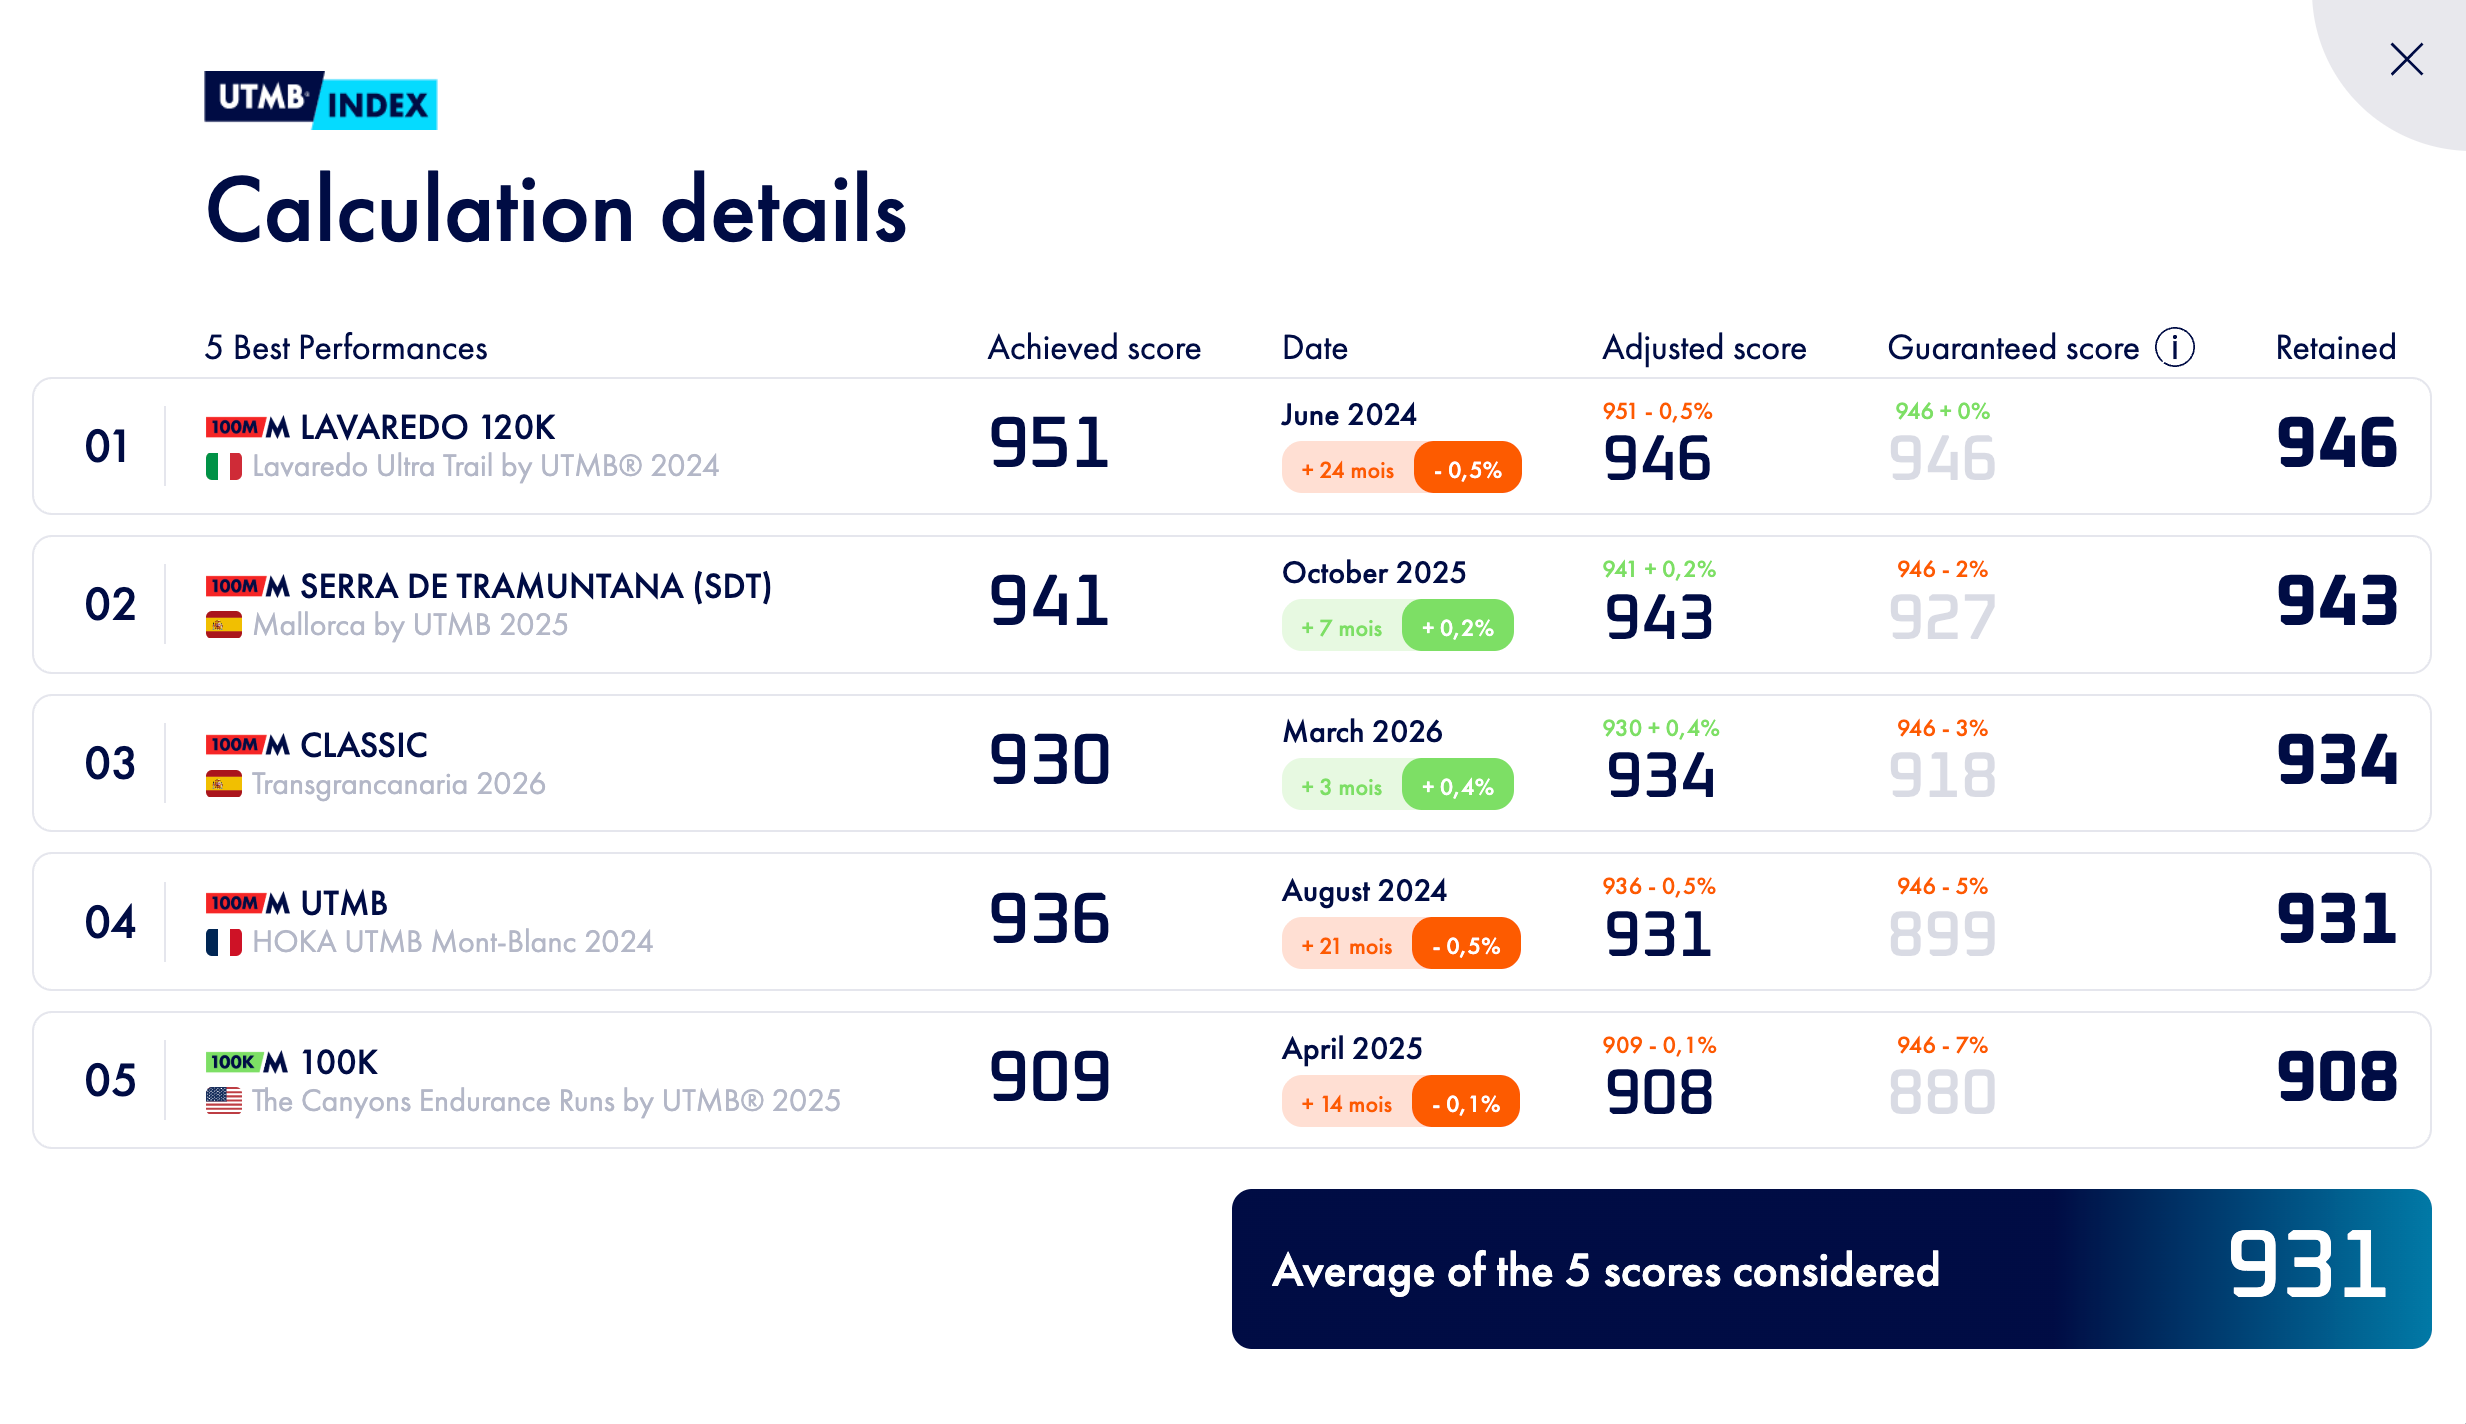
Achieved score — what you actually scored on the day. Fixed, never moves. Namberger’s best is his Lavaredo 120K from 2024: 951.
Date — the race date, how many months ago it ran, and a small adjustment percentage. This is the clock. More on it below.
Adjusted score — the Achieved score moved by that percentage.
Guaranteed score — a floor derived from your single best result. This is the part nobody is explaining. More on it below.
Retained — whichever is higher, your Adjusted score or your Guaranteed floor. That’s the value that actually counts.
And the number at the bottom — your Index — is simply the average of those five Retained scores: 931 across his general list, 927 in his 100M.
The clock: how a result ages
Look at the Date column and you’d assume the percentage is some opinion about each race. It isn’t. Across the whole sample, the adjustment depends on exactly one thing: how many months ago the race happened. Same age, same percentage — within a ranking, for every athlete, every race, every time. It’s not a judgment about the race. It’s a clock.
Recent results get a small bonus; older ones take a growing haircut, in fixed steps, until they fall out of the index entirely at 36 months. To see whether those steps were universal, I scraped the top 50 of every category, for both men and women — and read the bands off each panel. Here is what fell out:
Three patterns jump out, and each one is quietly telling.
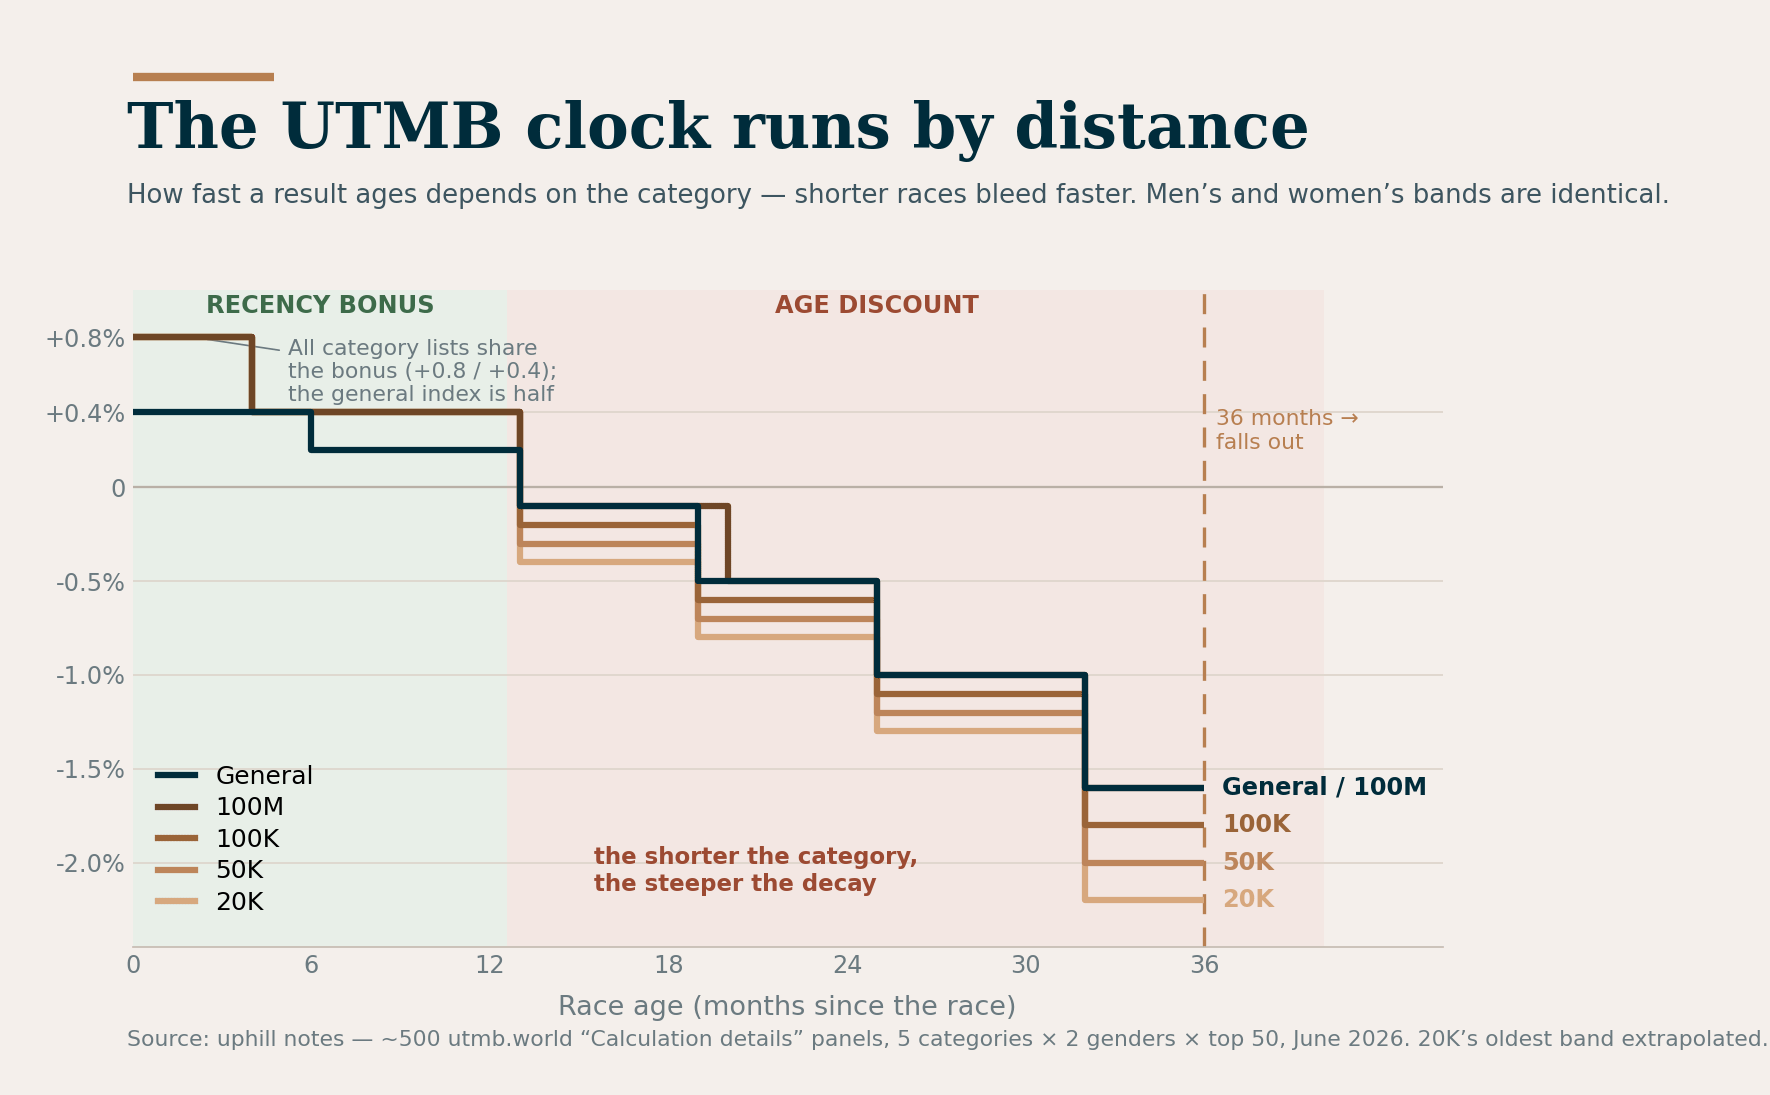
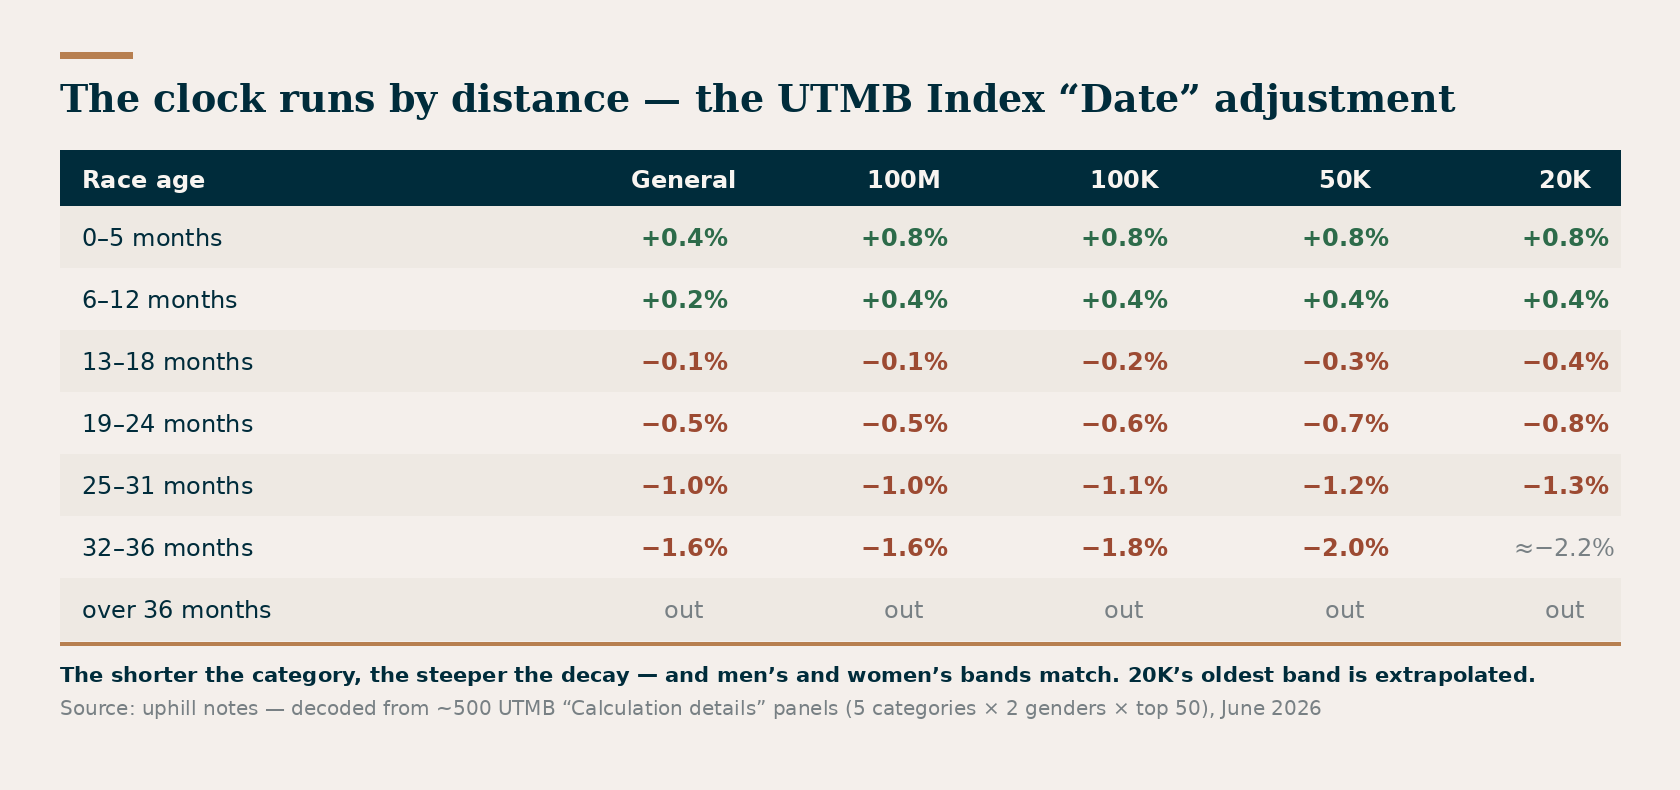
First, the decay runs by distance — a ladder, regular as stairs. Beyond about a year every category sheds value, but not at the same rate. The longest rankings, your general index and 100M, bleed slowest: −0.1, −0.5, −1.0, −1.6 across the four age bands. Drop to 100K and each step deepens a notch (−0.2, −0.6, −1.1, −1.8); 50K deeper still (−0.3, −0.7, −1.2, −2.0); the 20K, the shortest, sheds fastest of all (−0.4, −0.8, −1.3, past −2%). A two-year-old 20K result is docked −0.8% where a 100-miler the same age loses only −0.5% — about 1.5 times the bleed, and the gap only widens toward the cliff. The shorter your race, the faster its clock.
Second, gender doesn’t touch the clock. That’s why I pulled both fields: the women’s bands match the men’s to the decimal, category for category. Courtney Dauwalter’s 100M results age at exactly the rate Jim Walmsley’s do; a women’s 50K decays like a men’s 50K. The aging is a function of race distance, not of who ran it.
Third, the recency bonus is a specialist’s reward. A fresh result is worth +0.8% in any specific-distance ranking — 20K through 100M, all identical — but only +0.4% in the blended general index, halving again to +0.2% after six months. That resolves a puzzle that had me stuck: Namberger’s Transgrancanaria reads +0.4% in his general index and +0.8% in his 100M list — same race, same date, two numbers. The category list simply rewards recency twice as hard.
The practical reading: a result is worth most the day you run it, holds roughly its value for a year, and then bleeds out on a fixed schedule — faster the shorter the race. The only way to fight the decay on an aging best result is to go run a comparable race again.
The floor: the safety net nobody mentions
Now the column that genuinely changes how you should think about the index — the Guaranteed score.
Think of it as a safety net hung from your best result. The model takes your single best Retained score and rules that none of your other four counted races may be worth less than a set percentage of it. The further down the list a slot sits, the lower the net hangs — full value for slot one, then a fixed 2, 3, 5 and 7% below your best for slots two through five. For Namberger, whose best is 946, that sets floors of 946, 927, 918, 899 and 880. Whatever he actually ran in those races, the model won’t let them count for less.
How much the floor does depends entirely on the shape of your results. In Namberger’s general index it does nothing — his five best sit in a tight 40-point band, so every Adjusted score already clears its floor and the net stays dormant. But switch to his 100M category and it bites:
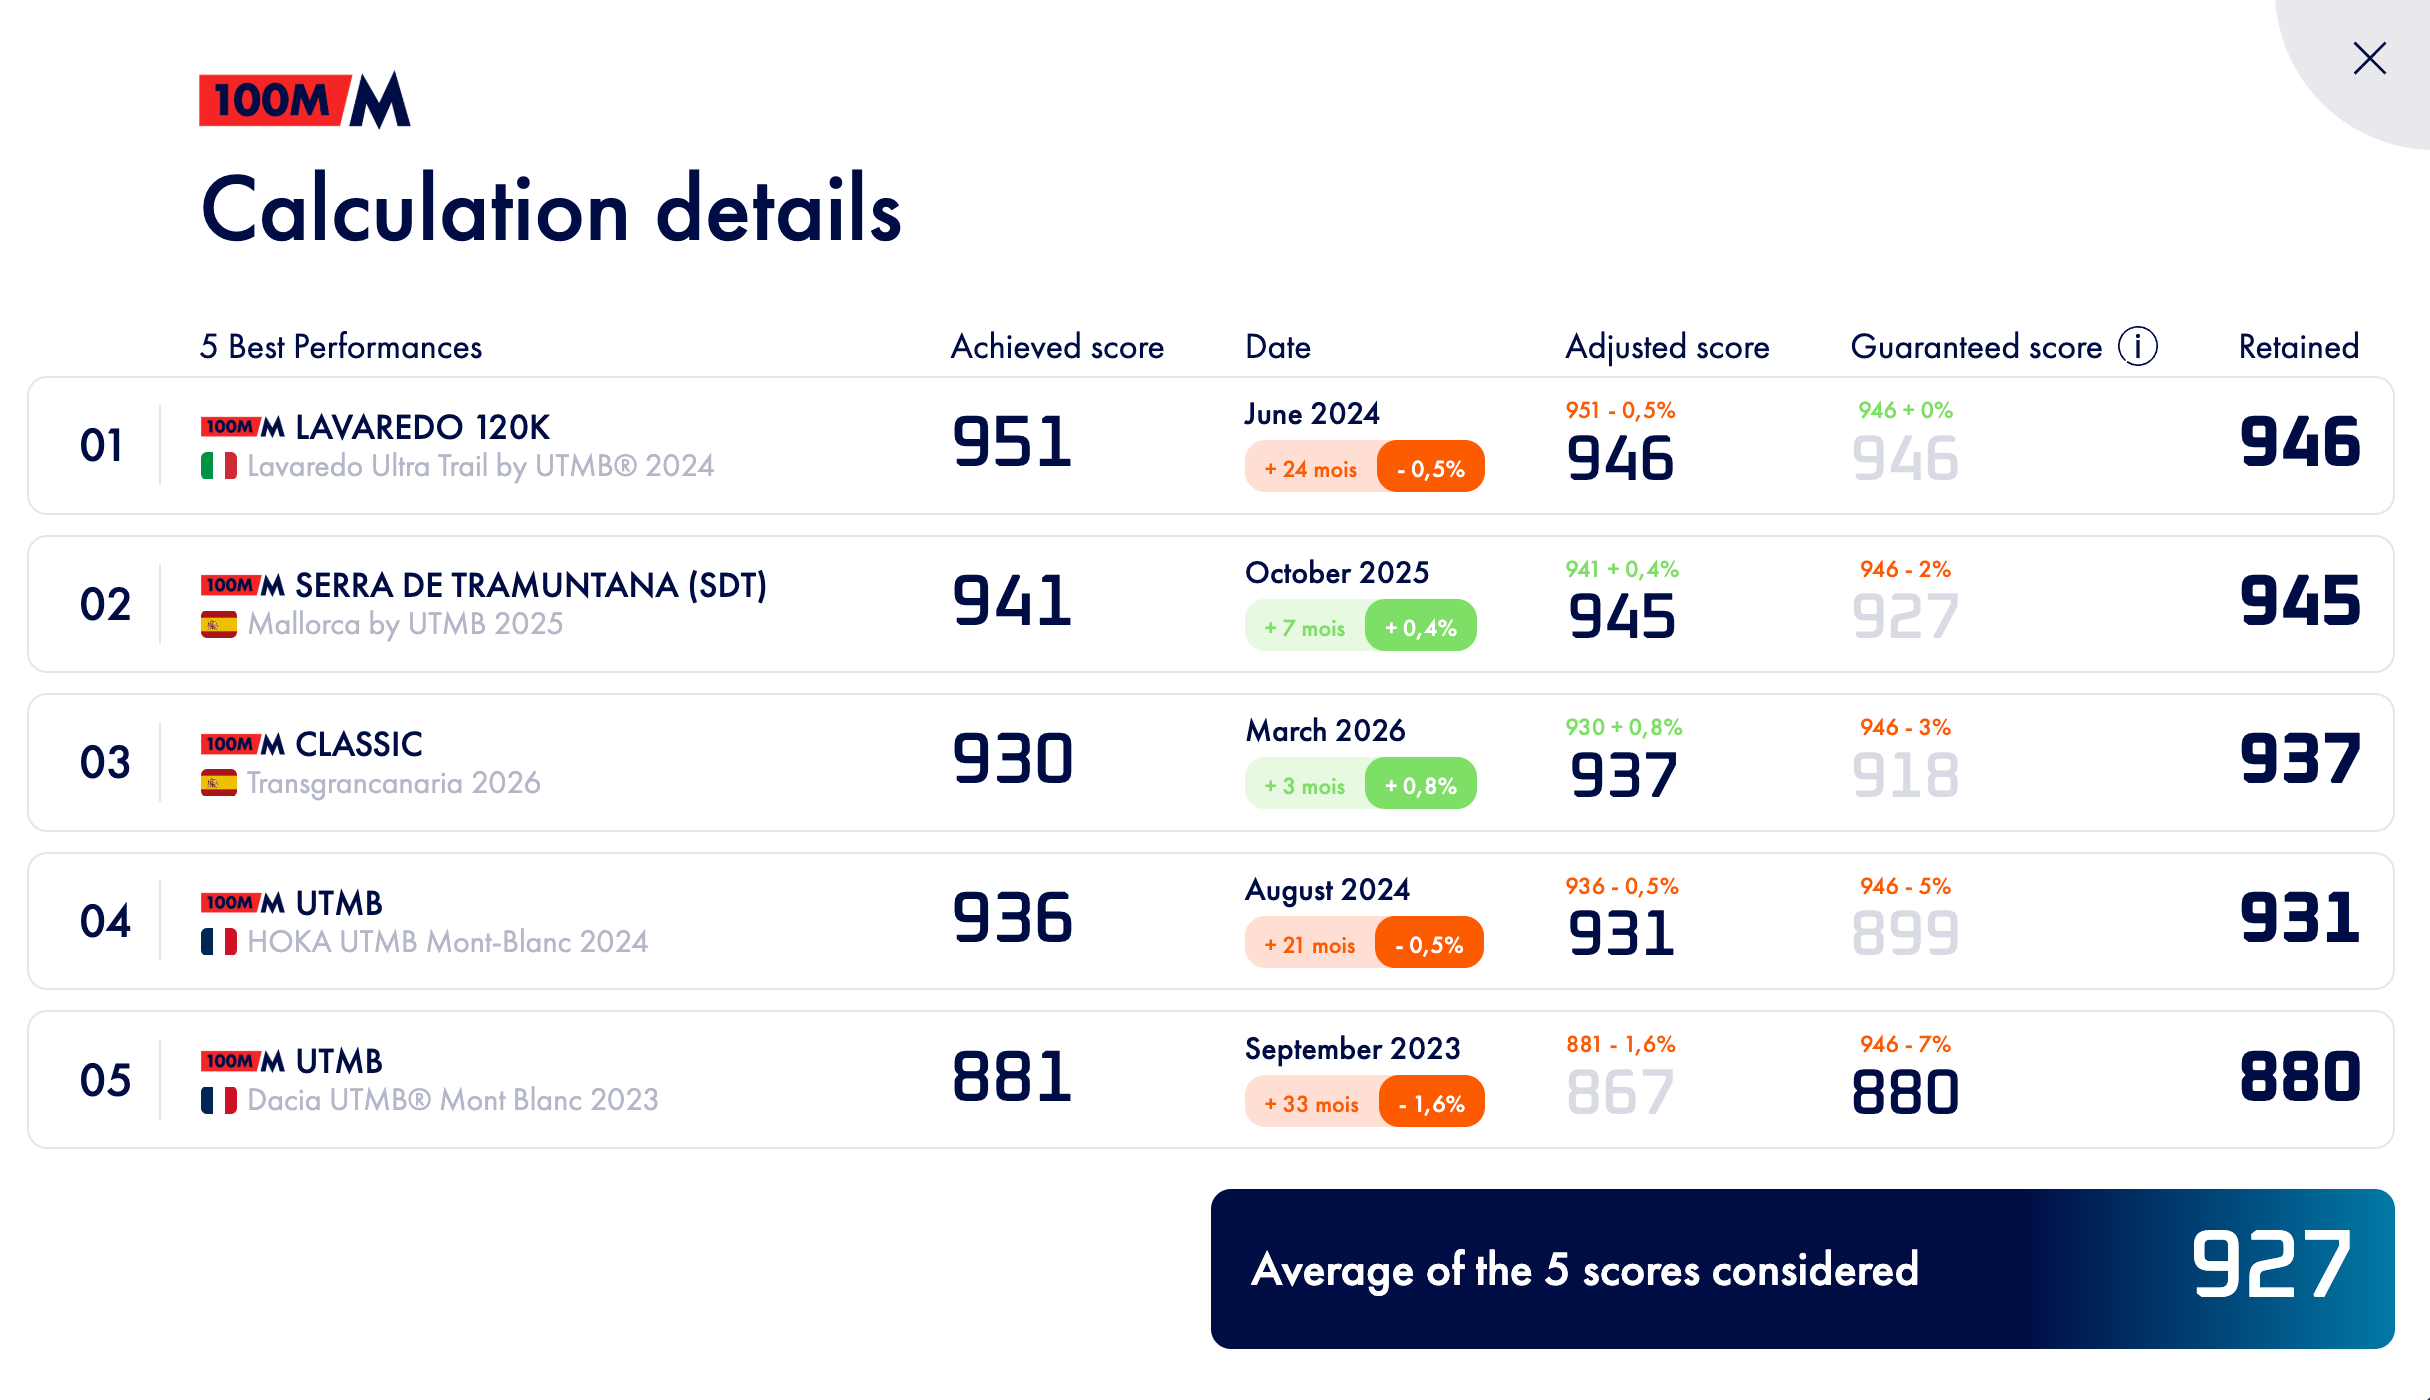
His 2023 UTMB, after the age haircut, is worth only 867. The floor props it back up to 880 — and that 880, not the 867, is what counts. On my own profile, where my results are more spread out, the same floor adds about 30 points and catches four of my five races. Same mechanism, completely different effect depending on how even your record is.
The floor also fills empty slots. Tom Evans has run only three races in the 100M category — so rows four and five on his panel have no achieved score at all. They’re filled by the guaranteed floor alone, at roughly 95% and 93% of his best. A runner with three strong 100-mile results is not penalized for not yet having five.
This is exactly how UTMB describes it, the one time they’ve described it in plain words. Walking through the new index on Freetrail, UTMB’s Adrien Vincent put it like this:
“If someone’s best result is up here and their second result is down here, that second lower result will not impact their overall index … even if you’ve got one really good one and two really bad ones, it won’t impact it. We do a lot of calculations in the background to make sure that everyone gets the best possible index they possibly can.”
An index built on a single race
The most extreme case in my sample is Thomas Cardin (before Western States - last weekend). In his 100M category he has exactly one counted race — the Ultra Trail Chianti Castles 2026, worth 946 with the recency bonus. The other four rows on his panel have no achieved score at all. They exist only as floor, derived from that one result: 917, 917, 898 and 879.
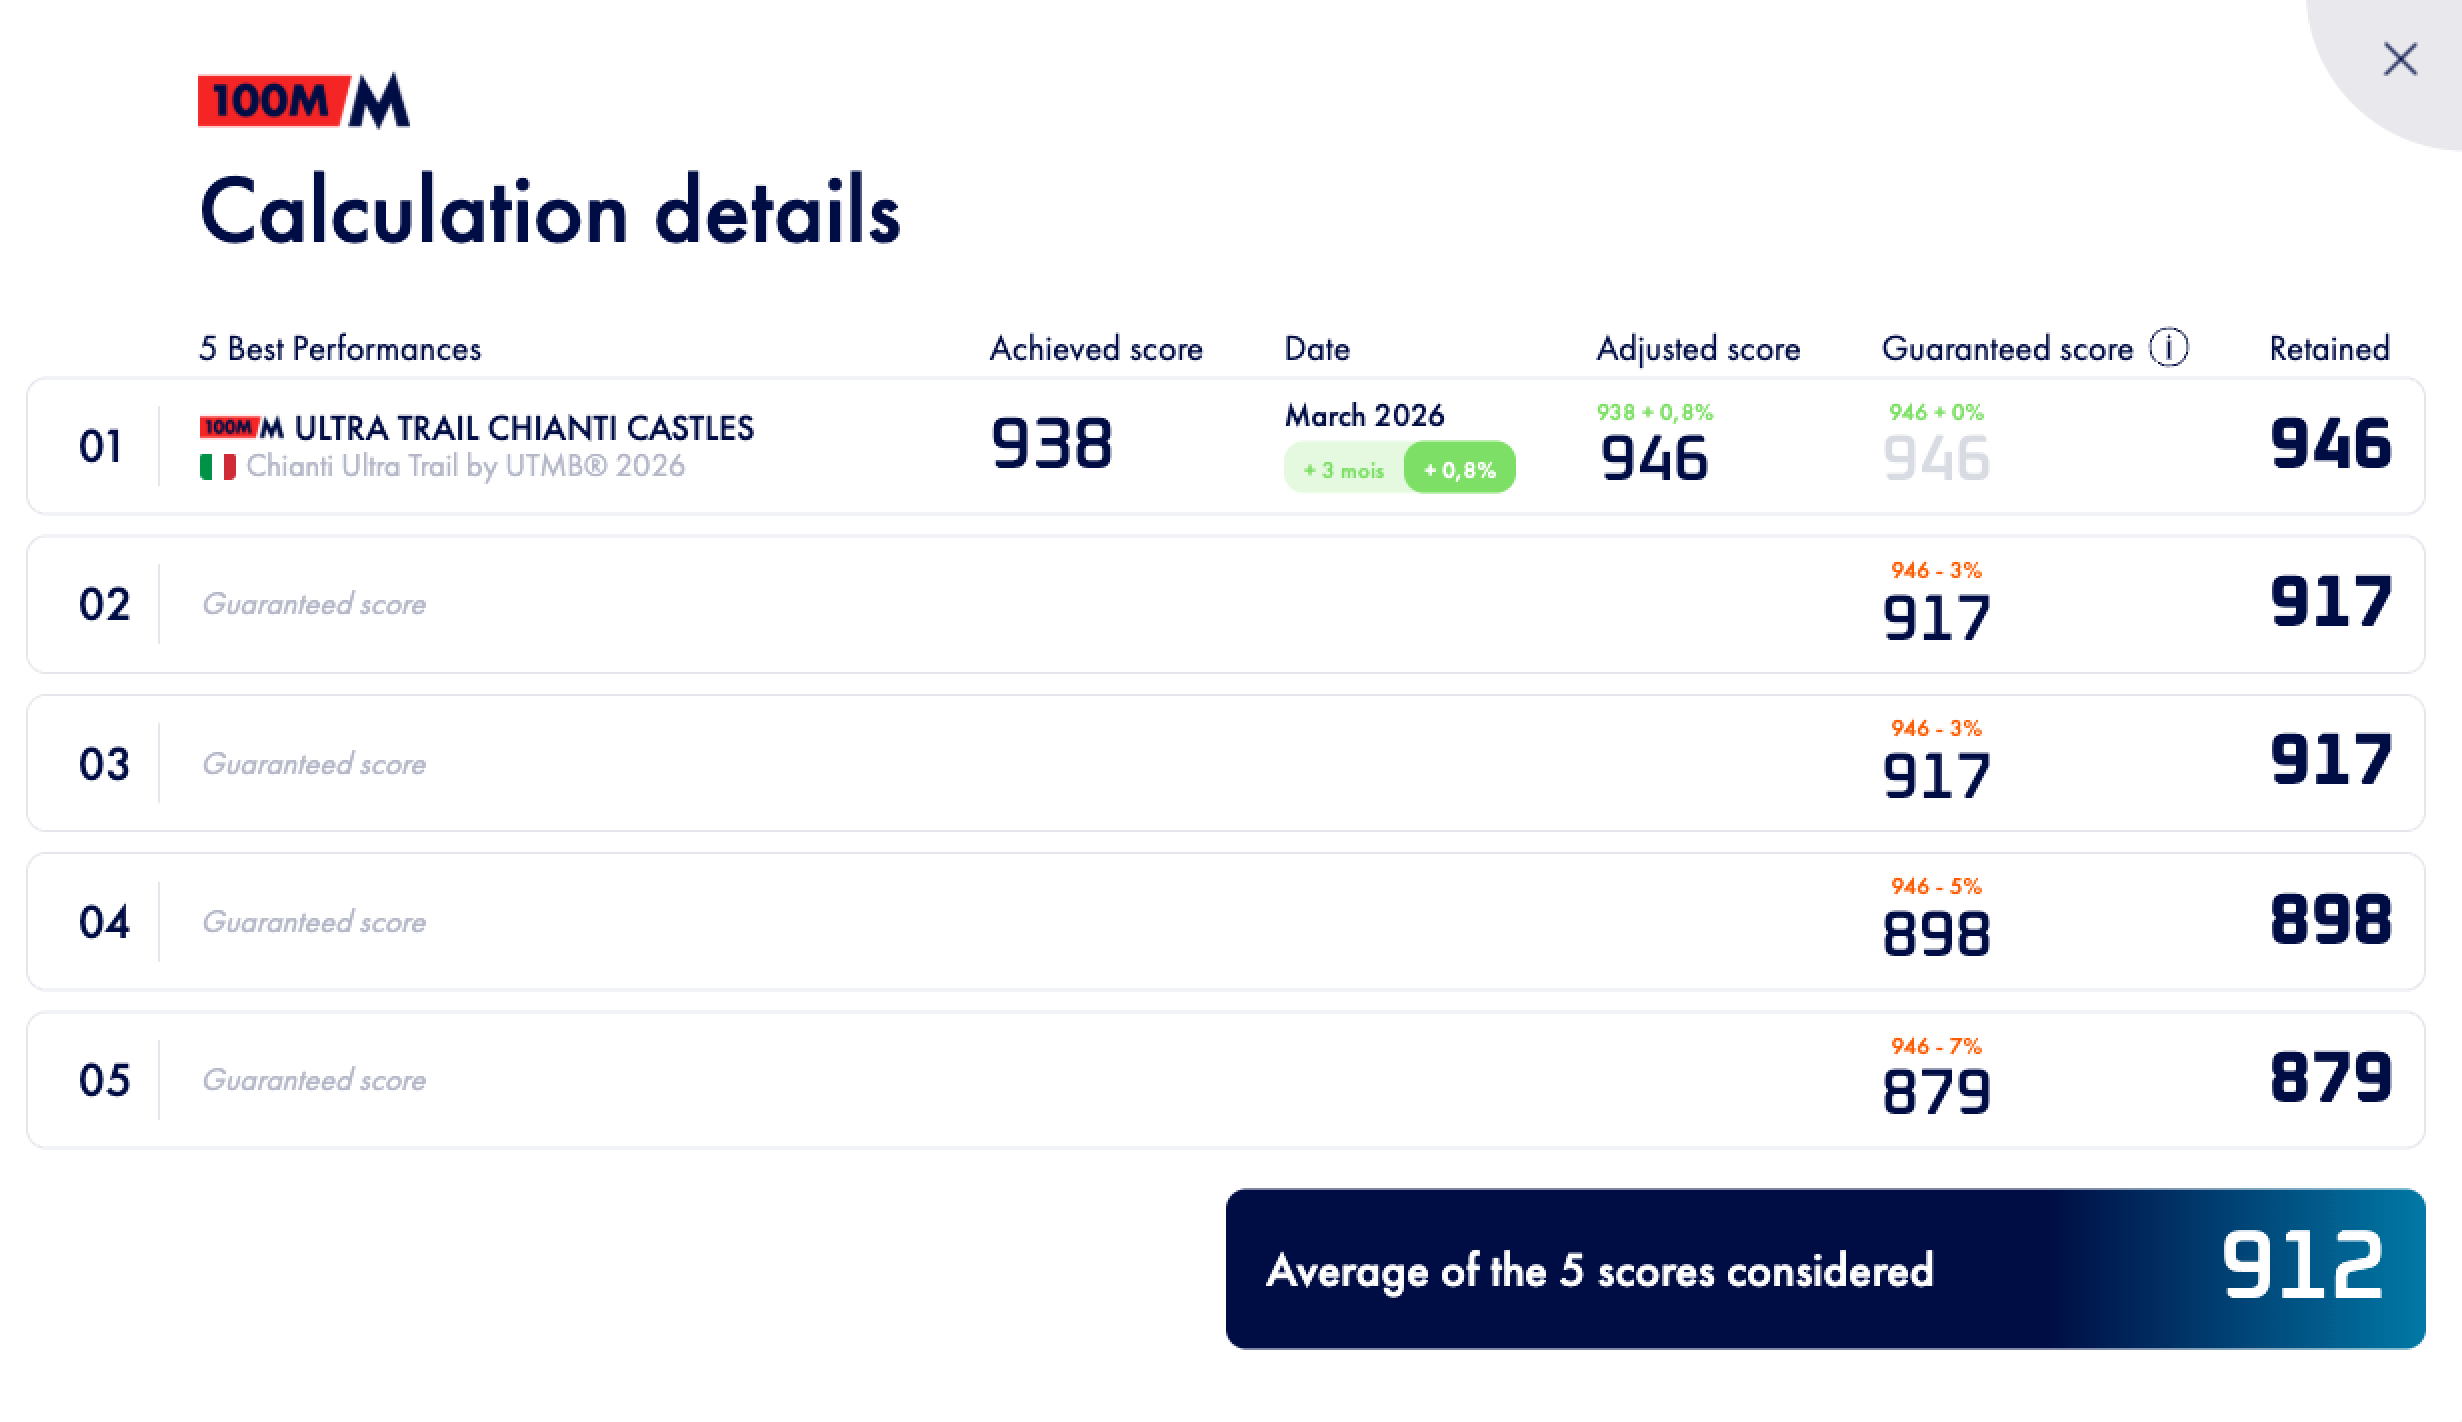
His entire 100M index of 912 therefore rests on a single race — four fifths of the number is pure guaranteed floor. This is the mechanic pushed to its limit: a runner new to a distance who delivers once, strongly, is handed a full-weight index built from that one result. It’s generous — and it’s a warning to anyone comparing these numbers. An index of 912 can mean five races of deep form, or one. The panel is the only thing that tells them apart.
Which leads to the correction that matters, and I had it wrong until I saw the panel: the UTMB Index is not a weighted average. The old ITRA-style understanding — best result weighted most, each subsequent one less — is gone. It’s a plain arithmetic mean of five Retained scores, several of which can be quietly held up by that floor. The depth of your record barely matters; the height of your single best, and how close your next four sit to it, is almost everything.
Who the floor lifts most
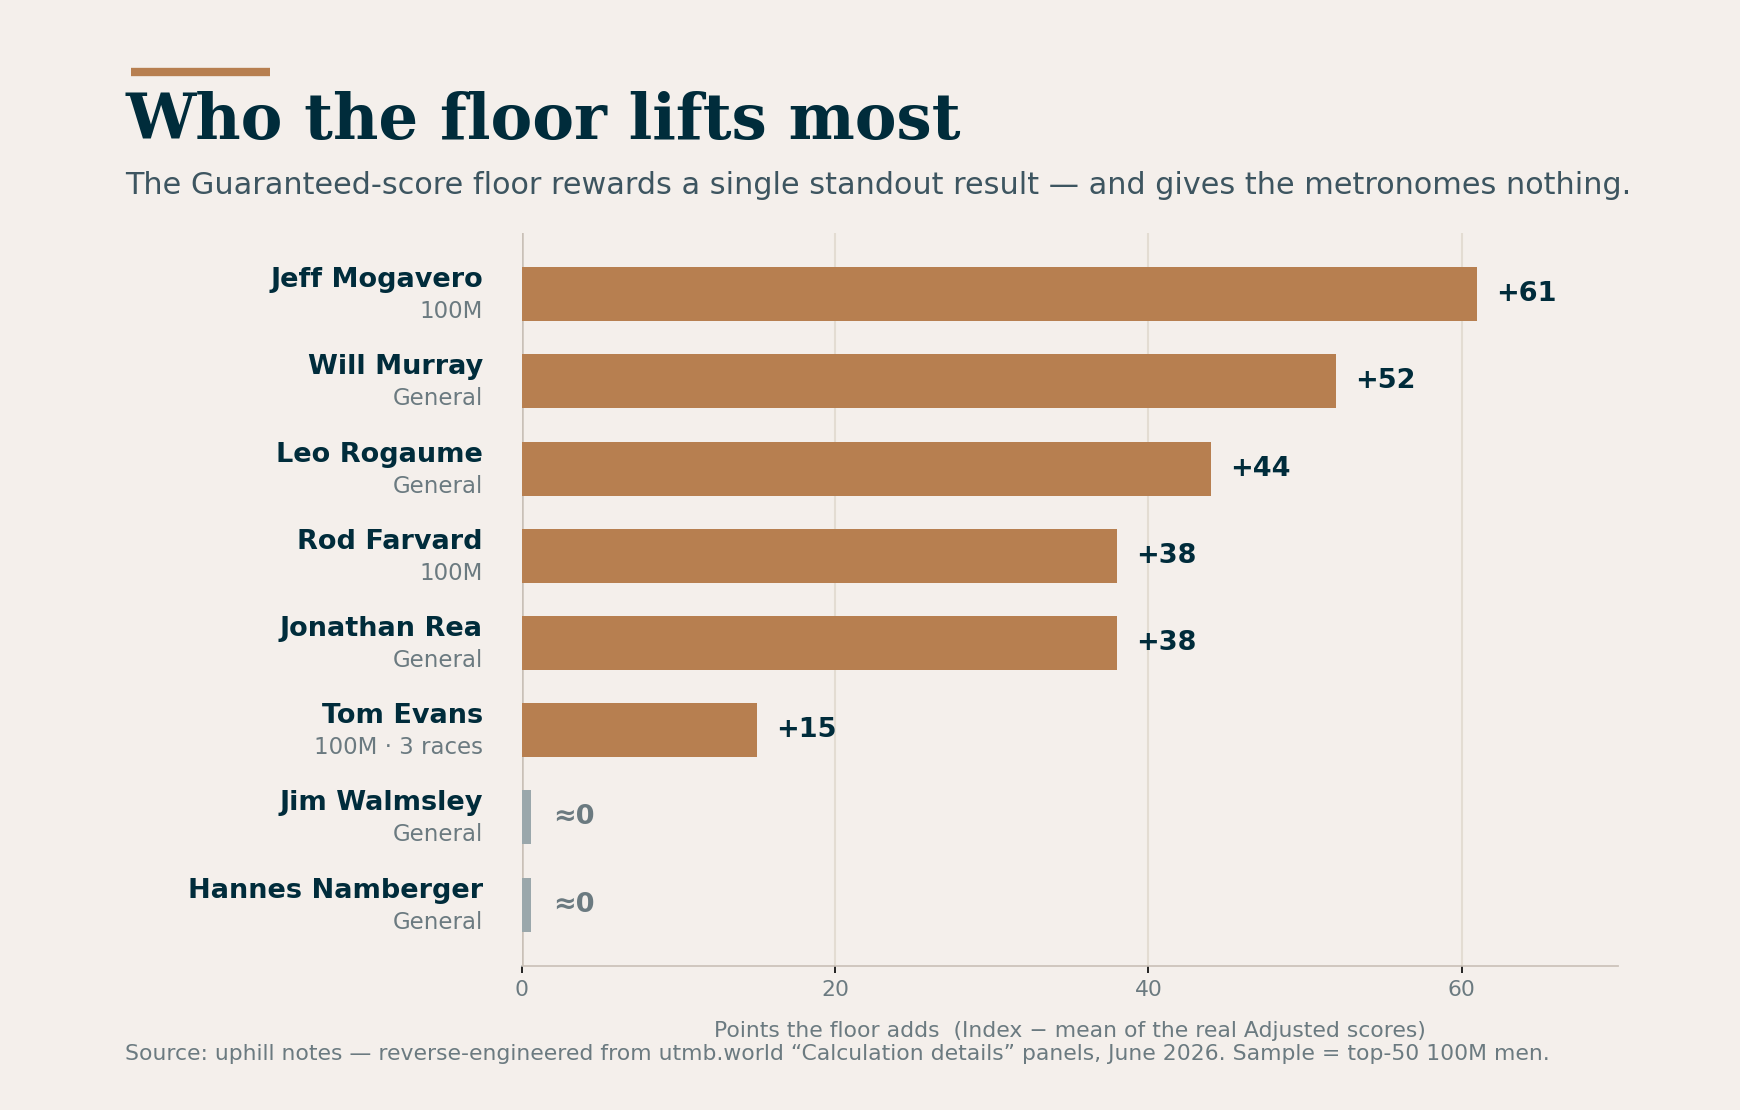
If the floor does nothing for one runner and carries half the index for another, the question is worth asking: for whom, exactly? I computed it across every 100M men’s panel — as the gap between the displayed index and the mean of the Adjusted scores actually earned. That number is precisely what the floor hands you. And it has a clear winner per list.
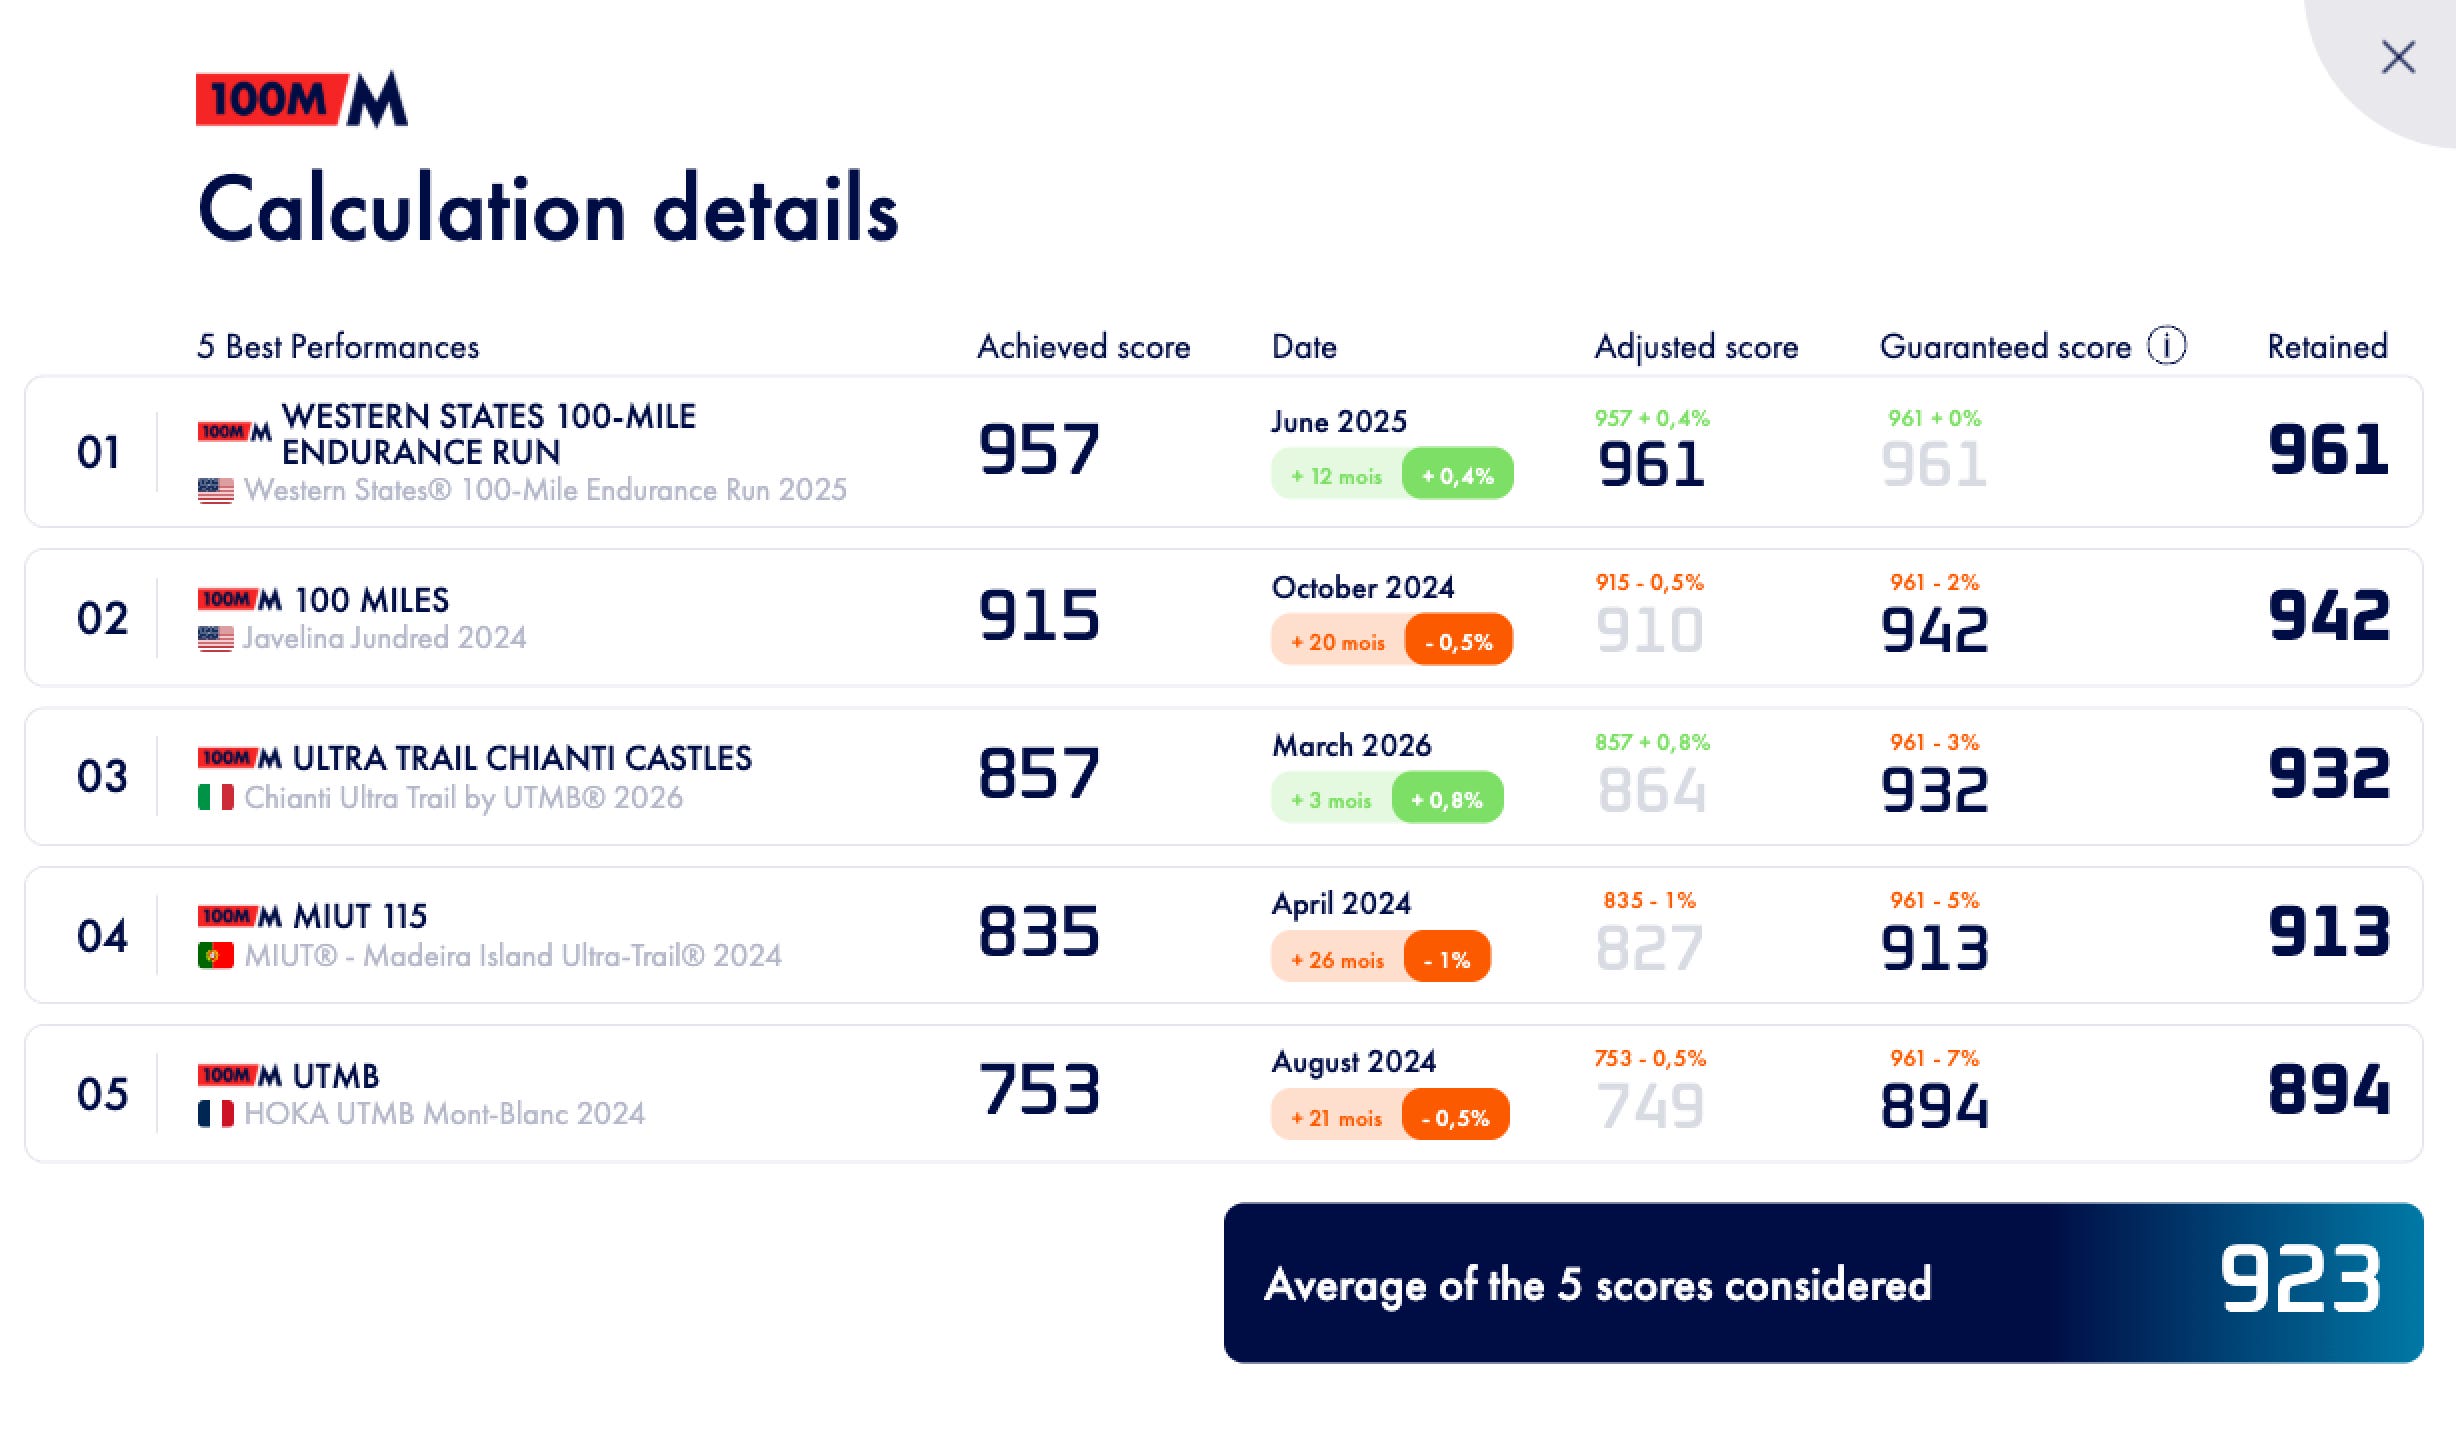
In the 100M category it’s Jeff Mogavero. His Western States 2025 (961) towers over the rest of his record; his four other results, after the age haircut, sit at 910, 864, 827 and 749. If the index simply averaged those, he’d stand at 862. He actually stands at 923 — because the floor lifts four of those five rows. His 2024 UTMB, worth only 749 on the day, ends up counting as 894. A gain of 61 points that comes purely from the shape of his record, not from one extra race.
In the general index it’s Will Murray — and he shows up at the top of both lists, the only double winner. His best race, a 100K worth 951, drags three much weaker real runs up with it: Canyons (840), Leadville (809) and Chuckanut (801) count, through the floor, as 923, 903 and 884. His index lands at 920 instead of around 868. Behind him, Leo Rogaume (+44, a TDS of 914 over runs as low as 776) and Jonathan Rea (+38, a 100-mile result of 913 over a 21K worth 716).
There are two ways to be carried by the floor. The first is Mogavero’s and Murray’s: one outlier up top plus real, weaker races — the bigger the gap between your best and the rest, the more the net hands you. The second is having fewer than five counted races, where the floor fills the empty slots at roughly 95 and 93% of your best. The 100M category shows this most plainly — Tom Evans, with only three races, banks +15 points that way. A single strong long-distance result carries almost the whole index there.
The opposite shows who gets nothing: the metronomes. Hannes Namberger, whose profile runs through this piece, and Jim Walmsley — both with a tightly clustered top five — get essentially nothing from the floor. If you’re evenly strong, you don’t need a net. The floor doesn’t reward depth; it rewards distance — a single best that stands out.
What this changes for an athlete and a coach
For the first time you can answer why is my index this number without guessing, and the planning levers fall straight out of it.
Your single best result sets the floor for the other four. One genuine breakthrough race doesn’t just add one number — it quietly lifts everything beneath it, because every floor is a percentage of that best. The fastest way to raise your index is rarely a fifth or sixth solid race; it’s one result clearly above your current ceiling.
A sixth strong performance only moves your index if it cracks the top five. Below that line it’s invisible, no matter how respectable. So once you have five good results inside 36 months, racing more for index points has sharply diminishing returns — a real argument for racing less and peaking harder.
And recency is a slow leak, not a cliff until the very end. A best result quietly loses half a percent a year after its first birthday, a full percent after two. If your ceiling is an aging race, the index quietly rewards going back to a comparable profile and resetting the clock.
The index grew up. It stopped being a number you’re handed and started being a model you can read. The clock and the floor were there all along — UTMB just finally let us see them.
What would you do differently with your own season if you could see the floor under your results?